“How much traffic does my website get?” seems like a simple question. In practice, the answer depends on what you’re measuring, which tool you’re using, and whether your visitors accepted a cookie banner.
Understanding website traffic isn’t just about watching a number go up. It’s about knowing which metrics actually matter, why your reports might show different numbers than you expect, and how to get data you can trust.
What is website traffic?
Website traffic refers to the visitors who come to your website. More specifically, it’s the data about those visits: how many people came, where they came from, what they did, and how long they stayed.
Traffic is typically measured in a few different ways:
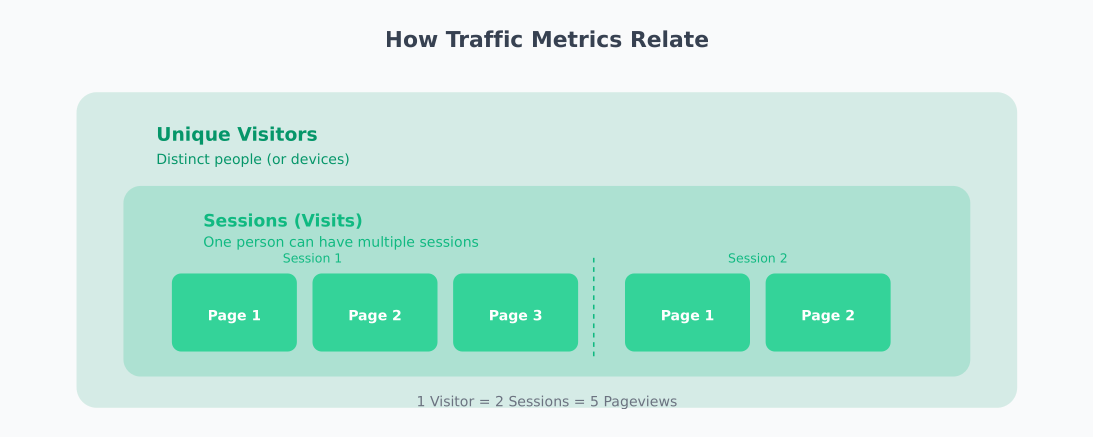
- Visits (sessions): The number of times people came to your site
- Unique visitors: The number of distinct people (or devices) who visited
- Pageviews: The total number of pages viewed across all visits
These numbers tell different stories. A site with 1,000 visits and 5,000 pageviews suggests engaged visitors viewing multiple pages. A site with 1,000 visits and 1,100 pageviews suggests most people leave after one page.
Why tracking traffic matters
Traffic data helps answer fundamental business questions:
Is my marketing working?
If you’re investing in content, SEO, ads, or social media, traffic data shows whether those efforts bring people to your site. Without it, you’re guessing which channels deserve more (or less) attention.
Are visitors finding what they need?
High traffic with high bounce rates might mean you’re attracting the wrong audience—or that your content doesn’t match what visitors expect. Traffic data helps identify these mismatches.
What content resonates?
Your most-visited pages reveal what your audience cares about. This guides future content decisions and helps prioritise improvements to high-traffic pages.
Am I growing?
Traffic trends over time show whether your audience is expanding, stable, or declining. Early warning signs in traffic data let you course-correct before problems compound.
Key traffic metrics explained
Not all traffic metrics are equally useful. Here are the ones worth understanding:
Sessions (visits)
A session is a single visit to your website. If someone arrives, browses three pages, and leaves, that’s one session with three pageviews. If they return an hour later, that’s typically counted as a new session.
Sessions tell you how often people come to your site, regardless of whether they’re new or returning.
Unique visitors
This attempts to count distinct people rather than visits. One person visiting five times would count as one unique visitor but five sessions.
The “unique” part is approximate—it’s usually based on cookies or device fingerprinting, which isn’t perfect. The same person on different devices might be counted twice.
Pageviews
Every time a page loads, that’s a pageview. One visitor viewing ten pages generates ten pageviews. This metric shows total content consumption across your site.
Pages per session
The average number of pages viewed during a visit. Higher numbers generally indicate engaged visitors exploring your content. Lower numbers might be fine for simple sites (a restaurant menu page) but concerning for content sites.
Average session duration
How long visitors typically spend on your site. Like pages per session, longer isn’t always better—it depends on your site’s purpose. A support page that answers questions quickly might have short sessions by design.
Bounce rate
The percentage of visitors who leave after viewing only one page. A high bounce rate might indicate:
- Content doesn’t match visitor expectations
- Poor user experience or slow loading
- Visitors found what they needed immediately (not always bad)
Context matters. A blog post answering a specific question might have a high bounce rate because visitors got their answer—that’s success, not failure.
Traffic sources
Where your visitors come from:
- Organic search: From search engine results (unpaid)
- Direct: Typed your URL or used a bookmark
- Referral: Clicked a link on another website
- Social: From social media platforms
- Paid: From advertisements
Understanding sources helps you invest in channels that work and identify underperforming ones.
New vs returning visitors
The split between first-time visitors and those who’ve been before. A healthy site typically needs both: new visitors for growth, returning visitors for engagement and loyalty.
Why your traffic numbers might be wrong
Here’s something that surprises many website owners: your analytics might be significantly undercounting your actual traffic.
The cookie consent problem
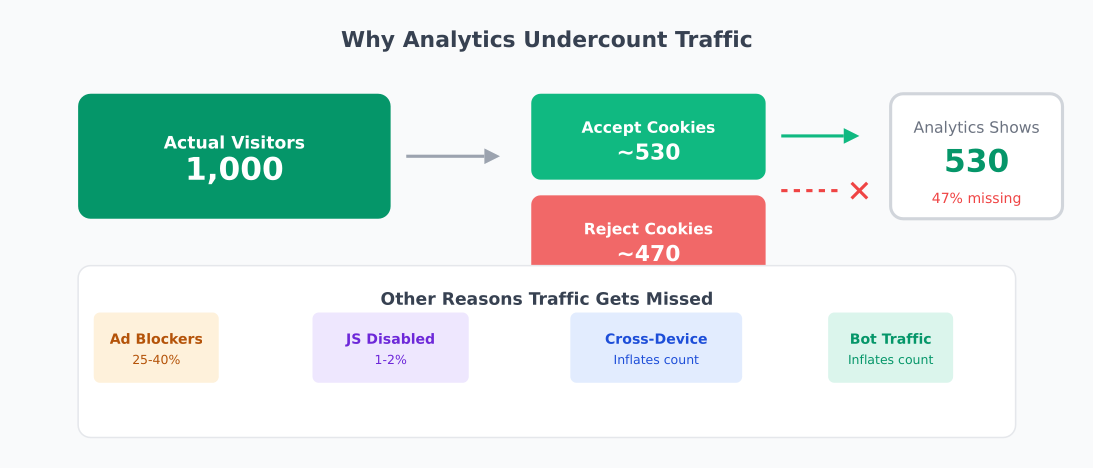
Many analytics tools require cookies to track visitors. Under GDPR and similar regulations, you need visitor consent before setting these cookies. When visitors click “reject” on cookie banners, they become invisible to your analytics.
How significant is this? Research suggests around 47% of EU adults reject tracking cookies. If half your European visitors decline cookies, your analytics shows half your actual traffic from that region.
This isn’t a minor discrepancy—it fundamentally skews your data. The visitors who reject cookies might behave differently from those who accept, meaning your analytics represents a biased sample.
Ad blockers
Many ad blockers also block analytics scripts. Estimates vary, but 25-40% of visitors might use ad blockers depending on your audience (tech-savvy audiences skew higher). These visitors generate zero data in most analytics tools.
Bot traffic
Automated bots constantly crawl websites—search engines indexing content, security scanners, scrapers, and malicious bots. Good analytics tools filter most bot traffic, but some gets through, inflating your numbers.
Cross-device tracking limitations
When someone visits your site from their phone, then later from their laptop, most analytics tools count them as two unique visitors. This inflates unique visitor counts while fragmenting your understanding of individual behaviour.
Choosing an analytics approach
Different analytics tools make different trade-offs between data depth and privacy compliance:
Traditional analytics
Tools like Google Analytics offer extensive features but require cookie consent in many jurisdictions. You get detailed data about visitors who consent, but nothing about those who don’t.
Pros: Feature-rich, free, integrates with advertising platforms
Cons: Cookie consent required, data sent to third parties, complex to configure properly
Privacy-first analytics
Tools like Plausible, Fathom, and Umami are designed to work without cookies and without requiring consent banners. They collect less granular data but capture more visitors.
Pros: No cookie consent needed, captures all visitors, simpler dashboards, data stays private
Cons: Less detailed user-level data, fewer advanced features, paid (though often affordable)
Self-hosted analytics
Tools like Matomo can be self-hosted, giving you full control over data. With proper configuration, they can operate without cookie consent while still providing detailed analytics.
Pros: Full data ownership, configurable privacy settings, feature-rich
Cons: Requires server management, more complex setup
Server-side analytics
Analysing server logs provides traffic data that doesn’t depend on JavaScript or cookies. Every request to your server gets logged regardless of browser settings.
Pros: Captures all requests, immune to ad blockers, no client-side code
Cons: Limited behavioural data, includes bot traffic, harder to analyse
Making sense of your data
Raw traffic numbers rarely tell the full story. Here’s how to extract useful insights:
Focus on trends, not absolutes
Whether your analytics shows 10,000 or 8,000 monthly visitors matters less than whether that number is growing or shrinking. Consistent measurement over time reveals patterns that absolute numbers miss.
Segment your data
Overall traffic averages hide important patterns. Break down your data by:
- Traffic source: Organic visitors might behave very differently from social visitors
- Device type: Mobile and desktop experiences often produce different metrics
- Landing page: Different content attracts different audiences
- Geography: Regional differences affect behaviour and conversion
Connect traffic to outcomes
Traffic alone doesn’t pay bills. Connect your traffic data to business outcomes:
- Which traffic sources produce the most conversions?
- Which pages lead visitors to take desired actions?
- What’s the path from first visit to conversion?
A page with modest traffic but high conversion rates might be more valuable than a high-traffic page that doesn’t lead anywhere.
Account for seasonality
Most websites have predictable traffic patterns—weekday vs weekend, seasonal peaks, holiday slowdowns. Compare this month to the same month last year, not just to last month.
Related reading
Summary
Website traffic measurement sounds straightforward but involves real complexity:
- Multiple metrics tell different stories—sessions, unique visitors, and pageviews each reveal something different
- Cookie consent and ad blockers can hide 30-50% of your actual traffic from traditional analytics
- Privacy-first tools capture more visitors but offer less granular data
- Trends matter more than absolutes—consistent measurement reveals patterns regardless of exact numbers
The goal isn’t perfect data—it’s useful data. Choose tools that align with your privacy values and business needs, measure consistently, and focus on connecting traffic to outcomes that matter.
Your actual traffic is probably higher than your analytics shows. That’s okay. What matters is understanding the traffic you can measure and making decisions based on reliable trends.