What Are Customer Segments? A Simple Guide for Web Analytics

If you manage a website long enough, you start to notice something: not all visitors behave the same way. Some arrive, bounce in two seconds and never come back. Others visit every week, read your content and eventually buy.
Marketers and analysts call these groups customer segments. The phrase sounds big and scary, but in web analytics it’s actually simple: a segment is just a set of visitors who match the same rule in your reports.
In this guide, we’ll answer a very down-to-earth question: what are customer segments in the context of web analytics, and how can you use them to make better decisions without becoming a data scientist?
We’ll walk through the basic ideas, show how segments are built from your existing data, give practical examples and then connect everything to marketing actions like campaigns and personalisation.
Why customer segments matter in web analytics
Let’s start with a clear definition.
A customer segment is a group of users who share something important in common:
they come from the same channel, behave in a similar way, buy the same kind of products, or are at a similar stage in their journey.
Why is that useful?
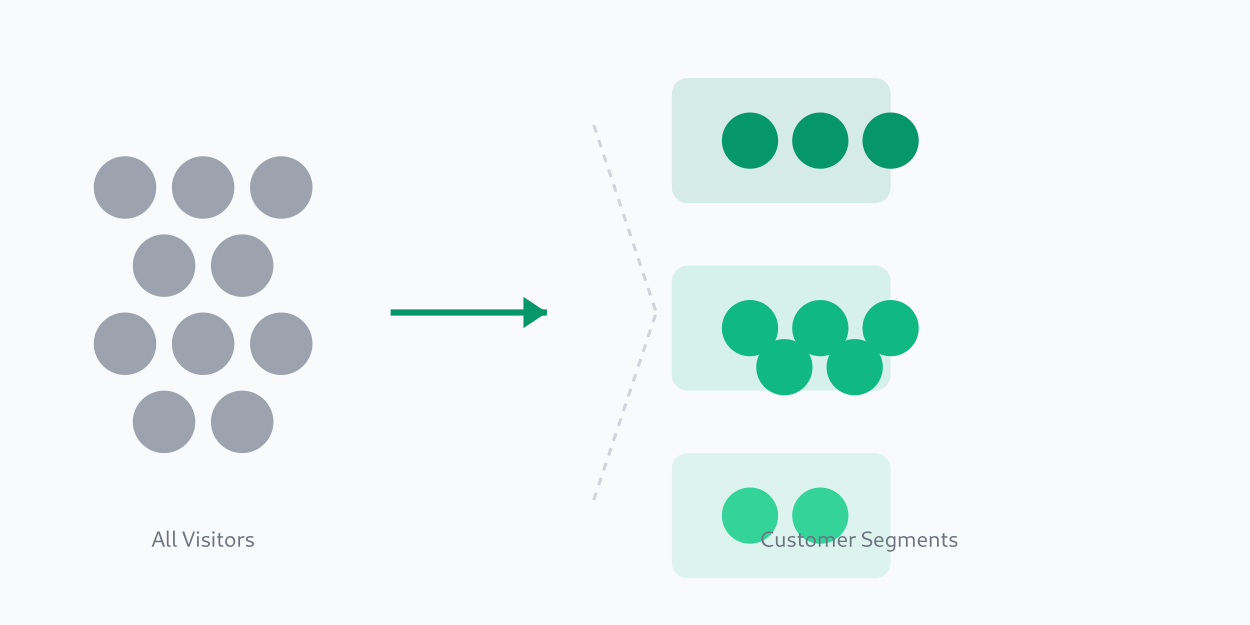
- Looking at all visitors at once hides big differences inside your traffic.
- Splitting your audience into segments lets you see which groups convert well, which groups struggle and which groups bring the most value over time.
- Segments help you answer better questions:
- “Which visitors are most likely to become customers?”
- “Which content actually warms people up before they buy?”
- “Which campaigns bring users who never return?”
In a typical analytics tool, segments are:
- filters on reports (“only users from email who bought at least once”),
- saved audience definitions (“returning visitors who viewed pricing”),
- or conditions inside dashboards.
So instead of staring at a single average conversion rate, you might see:
- New visitors from paid search: 0.5% conversion
- Returning visitors from email: 7% conversion
- Existing customers: 20% conversion on add-on offers
Same website, very different stories.
If you want some classic theory behind this idea, you’ll often see it under market segmentation in marketing on Wikipedia, or in a more practical format as a customer segmentation guide from HubSpot. But here we’ll keep our feet in the web analytics world.
Customer segmentation basics: how it works with web data
In plain language, customer segmentation is just the habit of dividing your user base into groups based on shared characteristics that matter for your goals.
On the web, those characteristics usually come from data you already have:
- Pages viewed (homepage, blog, pricing, checkout, docs)
- Number of visits and time between visits
- Devices and screen sizes
- Traffic source or campaign
- Events like “signed up”, “added to cart”, “completed purchase”, “watched video”
- Revenue, number of orders, plan type, and so on
A simple loop for segmentation with web data looks like this:
- Collect events and properties
You track page views and key actions (signups, purchases, downloads) along with useful properties like channel, device, plan and country. - Group users into segments
You define rules: “users with 3+ sessions in the last 30 days” or “people who viewed pricing at least twice”. - Compare metrics per segment
You look at conversion rate, average revenue, retention, engagement, etc. for each group. - Take action
You adjust landing pages, run separate campaigns or build product experiments for specific segments instead of “everyone at once”.
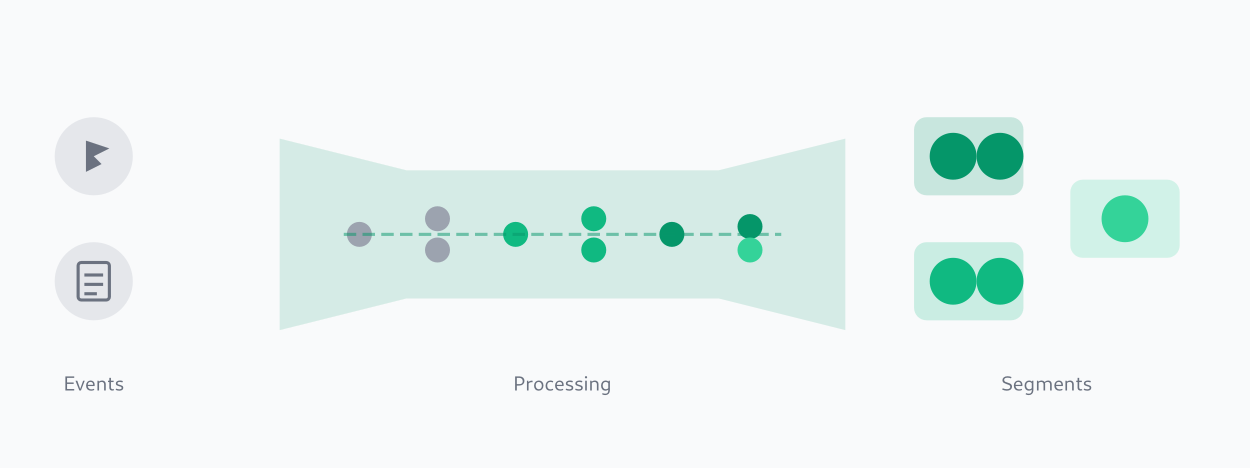
If you want a more academic description, you can look at a customer segmentation overview from Coursera, but the core idea is exactly this little loop: collect → group → compare → act.
Types of customer segmentation and where the data comes from
In textbooks you’ll often see lists of types of customer segmentation. These are high-level categories that describe how you decide to split your audience.
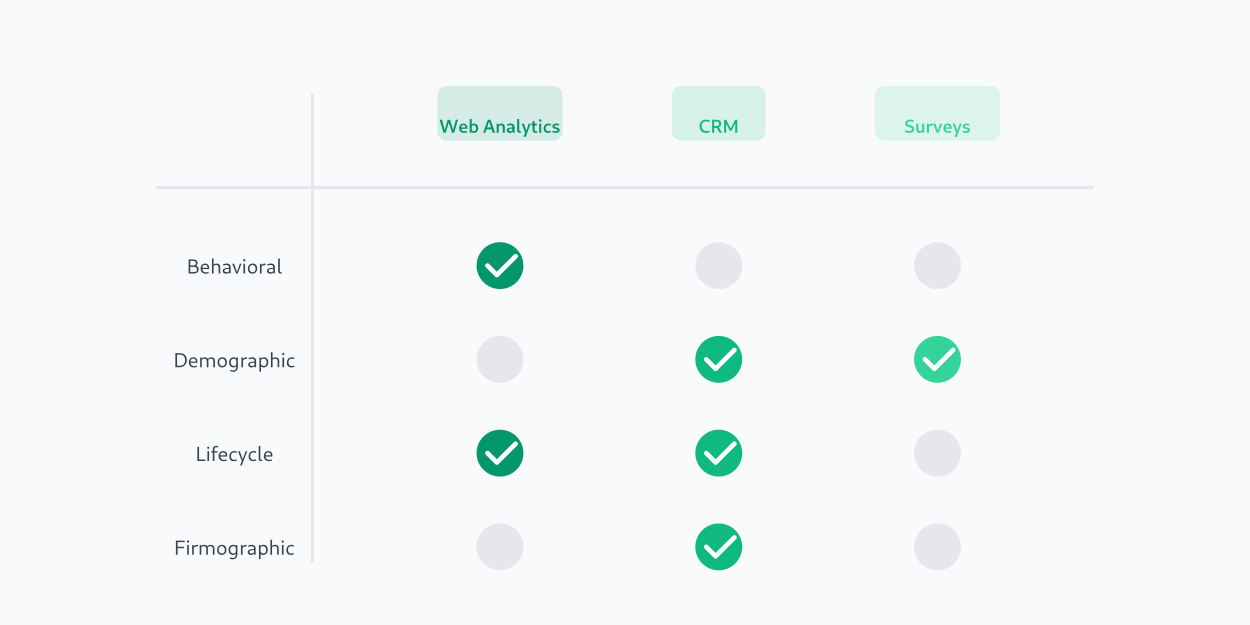
In the real world, each type depends on different data sources:
- Some data naturally lives in web analytics (behaviour, sessions, events).
- Some sits in your CRM or data warehouse (contracts, invoices, company size).
- Some exists only if you ask users directly (surveys, forms, interviews).
Understanding where each type comes from helps you decide what you can do with web data alone, and where you need to connect other systems.
High-level types: demographic, geographic, firmographic
Demographic segmentation splits people by personal attributes such as:
- age,
- gender,
- income,
- family status,
- education.
Most of this information does not live in your analytics logs by default. It usually comes from:
- registration profiles,
- surveys,
- or external data providers.
Geographic segmentation is based on where people are:
- country,
- region,
- city.
Here web analytics can help more: location can often be estimated from IP-based geo data, at least at country or city level. You still need to be careful with accuracy and privacy, but you don’t necessarily need a separate system.
Firmographic segmentation is mostly for B2B. It splits accounts by:
- company size,
- industry,
- revenue band,
- business model.
This information usually lives in CRM, enrichment tools or sales notes. Web analytics can show you which accounts visit, and what they do, but firmographic details almost always come from outside.
If you want a business-oriented view of these classic types, a helpful resource is the customer segmentation strategy guide from Zendesk.
Behavioural and lifecycle segments from analytics
This is where web analytics really shines.
Behavioural segmentation focuses on what people actually do:
- which pages they view,
- which actions they take (sign up, search, watch, add to cart),
- how often they return,
- how long they stay engaged.
You might define behavioural groups such as:
- “Readers” – users who visited 3+ blog articles in the last 14 days.
- “Researchers” – users who visited pricing and comparison pages.
- “Evaluators” – users who started signup but didn’t finish.
Lifecycle segmentation looks at where someone is in their journey with you:
- New visitors (first visit within the last X days).
- Active users (recent visits and actions).
- Loyal customers (many orders or long subscription time).
- At-risk users (activity has dropped).
- Churned users (no activity for a long time).
In an analytics tool, lifecycle segments are usually defined by a mix of dates (“first seen”, “last seen”), number of sessions, and key events like “subscribed”, “purchased”, “canceled”.
Product segmentation: grouping plans, categories and SKUs
You don’t have to segment only people. You can also apply product segmentation to your offering:
- group similar plans into tiers (Basic, Pro, Enterprise),
- group items into product categories (shoes, jackets, accessories),
- group SKUs into bundles or collections.
Once you have product groups, you can cross them with user behaviour in analytics:
- Which segments of users buy which categories?
- Which plans attract high-value customers vs low-value?
- Which product groups are popular with new visitors vs long-time customers?
Seeing these patterns helps you decide:
- which categories to feature on the homepage,
- which plans to highlight to specific segments,
- where to invest in content, UX and support.
Types of customer segments you can build from web analytics
So far we’ve talked about theory. Now let’s get practical and look at types of customer segments you can build directly from web analytics data.
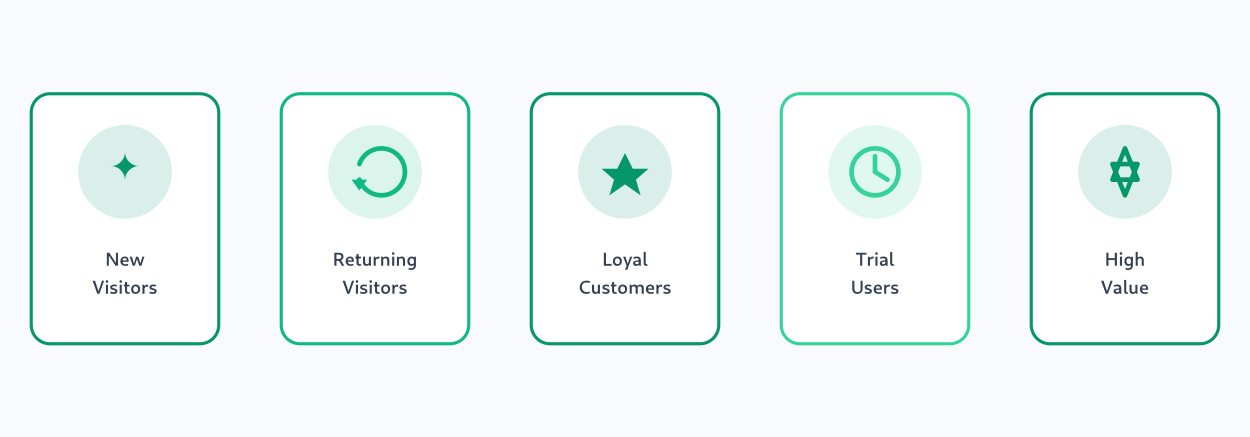
Think of these as “starter packs”: simple, understandable groups that almost any site can create using basic events and properties.
You don’t need dozens. Often 5–10 well-chosen segments are enough to change how you see your traffic.
Engagement-based segments (how often and how deeply they interact)
Engagement focuses on frequency and depth of interactions. Here are some user segmentation examples you can implement with just sessions and page views:
- New visitors vs returning visitors
- New: first seen in the last 30 days, 1–2 sessions.
- Returning: at least 2 sessions over a certain period.
- Highly engaged readers
- Users who viewed 5+ content pages or spent more than N minutes on site in the last week.
- Quick bouncers
- Users with only one page per session and very short time on page.
- Frequent visitors
- Users with 5+ sessions in the last 30 days, regardless of whether they bought.
You define these segments using simple rules:
- number of sessions,
- number of pages per session,
- time on site,
- number of events.
Once defined, you can compare how each group behaves: which ones convert, which ones just lurk, and which ones might be worth nurturing.
Conversion and value-based segments
Next, you can create segments based on conversions and money. Here are some customer segments examples that almost any online store or subscription product can build:
- First-time buyers
Users who completed exactly one purchase. - Repeat buyers
Users with 2+ purchases in a given time window. - One-time buyers who never returned
Users who bought once and haven’t visited or purchased again in a long period. - High-value customers
Users who placed 3+ orders or spent more than a chosen amount.
You define these groups using:
- a “purchase” event,
- an order count per user,
- total revenue per user,
- dates of first and last purchase.
Comparing these segments gives you strong signals:
- Which channels bring more high-value customers?
- Which campaigns mostly bring one-and-done buyers?
- How does content consumption differ between high-value and low-value users?
Channel and intent-based segments
Finally, you can segment by where people came from and what they seem to be looking for.
Channel-based segments use traffic source data:
- Organic search visitors.
- Paid search visitors.
- Paid social visitors.
- Email and newsletter visitors.
- Referral / partner traffic.
Intent-based segments use behaviour:
- People who visited pricing or plans pages.
- People who viewed comparison or “why choose us” pages.
- People who read multiple blog posts but never opened product pages.
- People who spent time in docs or help center (often existing customers, evaluators or advanced users).
You can define these segments with combinations of:
- landing page URL patterns,
- viewed page categories,
- campaign parameters,
- key events like “started signup”, “downloaded guide”, “requested demo”.
This is where segments start to feel like real “stories” about users, not just numbers in a table.
A target segment walkthrough: from raw traffic to a clear audience
Let’s walk through one target customer segment example so you can see the idea from start to finish.
Imagine you run a product site with a blog, pricing page and signup flow. Right now your analytics shows “total visitors” and “overall conversion rate”, but you want to know: who are the people most likely to become good customers?
You might build the target segment in four passes:
- Start with all visitors
Everyone who visited the site in the last 90 days. This is your raw traffic. - Filter to visitors who showed buying intent
Keep only users who:- visited the pricing page at least twice, or
- viewed key product pages several times.
- Filter again to visitors who completed a soft conversion
From the “high-intent” group, keep only those who:- subscribed to the newsletter,
- started a free trial,
- or requested more information.
- Look for common patterns
Inside this filtered group, check:- Which channels bring them?
- Which countries or time zones dominate?
- Are they mostly on desktop or mobile?
- Which content did they read before taking action?
You might find something like:
- Most of them came from organic search and email.
- Many read 2–3 blog posts on specific topics before visiting pricing.
- They are more likely to be desktop users and visit during working hours.
Now you have a clear target segment: “Visitors from organic search and email who read product-related content, revisit pricing, and complete a soft conversion within 7 days.”
That’s a lot more useful for marketing and product work than just “all visitors” or “all signups”.
Customer segments in marketing: how to use them in campaigns
Now let’s turn to action. The real power of customer segments in marketing is that they let you stop sending the same message to everyone.
Here are some practical ways to use analytics-based segments in campaigns:
- Email and CRM campaigns
- Send welcome sequences tuned for new visitors who just signed up.
- Send loyalty offers or early access to high-value customers.
- Re-engagement flows for people whose activity is fading.
- Retargeting and paid ads
- Show reminder ads to cart abandoners or people who visited pricing but didn’t sign up.
- Exclude existing customers from “new user” campaigns.
- Build lookalike audiences based on your best segments.
- On-site personalisation
- Show different hero messages to new visitors vs returning customers.
- Highlight different product categories depending on what someone viewed before.
- Change CTAs for highly engaged readers (invite them to subscribe) vs first-time readers.
- A/B testing targeted by segment
- Run experiments only for high-intent visitors (e.g. those who visited pricing).
- Test different flows for mobile-only visitors vs desktop-heavy segments.
- Try different offers for one-time buyers vs repeat buyers.
If you’d like more inspiration on the marketing side, good resources include a customer segmentation analysis guide from Mailchimp, a customer segments in marketing guide from Forbes and a practical customer segmentation guide from Zapier.
The key point: analytics-based segments are most powerful when they don’t stay trapped in dashboards. They should inform your campaigns, creative, targeting and product decisions.
Summary – what to remember before you build your next segment
Let’s recap the main ideas.
- A customer segment is simply a group of users defined by clear rules. It’s not magic, it’s just a smarter way to read your data.
- Web analytics gives you rich behaviour and lifecycle signals, so you can build segments from what people actually do, not only from who they are on paper.
- Classic categories like behavioural, lifecycle and product groups become truly useful when you turn them into concrete segments you can see and compare in reports.
- Starting with a few simple segments—engagement, conversion, value, channel, intent—is often enough to discover completely different stories inside your “average” traffic.
- The real value appears when you connect these segments to real actions: campaigns, personalisation, experiments and product improvements.
You don’t need a huge, complex system to get started. One analytics tool, a handful of well-defined segments and a curious mindset are enough to begin seeing your visitors as real groups with different needs, not just as one big number.
Related reading
Jonathan Whitaker
Marketing analyst and CXL-certified optimizer with 6+ years of experience in web analytics, conversion optimization, and privacy-first data strategy. Former analytics lead for e-commerce and SaaS companies across North America, now focused on helping businesses make better decisions with less data. Specializes in Plausible, Umami, Matomo, and cookieless analytics. Based in Vancouver, BC.